Na Minha Rua
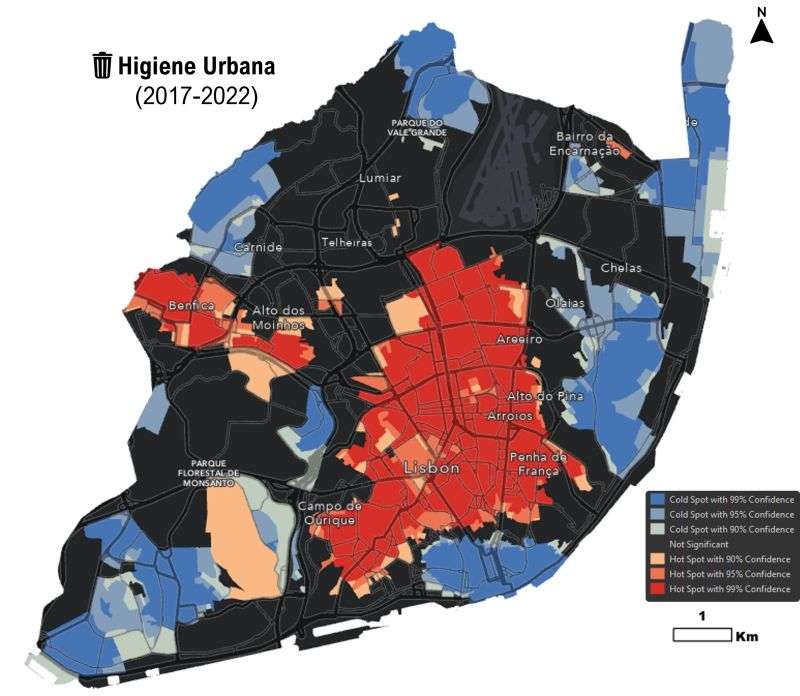
“Na Minha Rua” (https://lnkd.in/dazvhQuE) has published data through the Lisboa Aberta open data portal (https://lnkd.in/dxN4-AMb). This dataset provides useful information on issues reported by citizens relating to sidewalks and accessibility, urban hygiene, street lighting, roads and bike paths, trees and green spaces, housing, sanitation and others.
Publishing this dataset opens up new possibilities for research and analysis that can help us better understand the problems our city faces, develop more effective solutions and move from a reactive to a predictive response. As a first approach, through GIS and spatial analysis it is possible to visualize data in new ways and identify patterns that may not be immediately apparent. By mapping the data, we can see where problems are concentrated and identify areas where additional resources may be needed. Spatial analysis can also help us understand the relationships between different types of problems and identify potential solutions.
We can visualize how an optimized hotspot analysis can help us identify statistically significant spatial groups of census blocks with more (in red) or fewer (in blue) problems reported by citizens. A hotspot can be defined as an area that has a higher concentration of events compared to the expected number, given a random distribution of events. To be a statistically significant hotspot, a characteristic will have a high value and be surrounded by other characteristics with equally high values.
Walkability Indicator for Lisbon
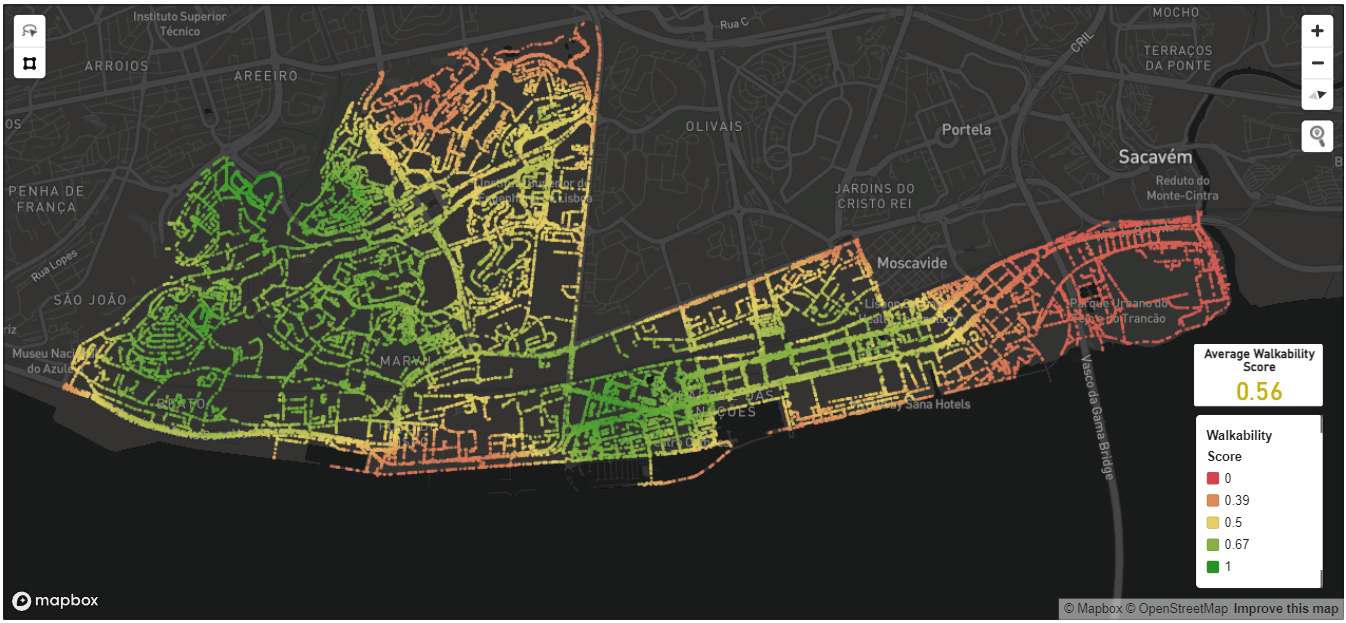
An innovative solution in urban planning and sustainable cities: a new walkability indicator developed as part of the C-Tech project: Climate Driven Technologies for Low Carbon Cities.
This indicator measures the level of pedestrian comfort for each meter of street, considering variables such as sidewalk conditions, slope and accessibility to points of interest. By analyzing data from mobile phone signals, we identified strong associations between the walkability indicator and pedestrian flow and that these associations vary according to the period of the week.
The walkability indicator has enormous potential to promote active transport, reduce pollutant emissions and create healthier and more sustainable communities.
This work was conducted by the NOVA Cidade – Urban Analytics Lab of the NOVA Information Management School and was published in the Journal Computers, Environment and Urban Systems.
Risk of emergency occurrences
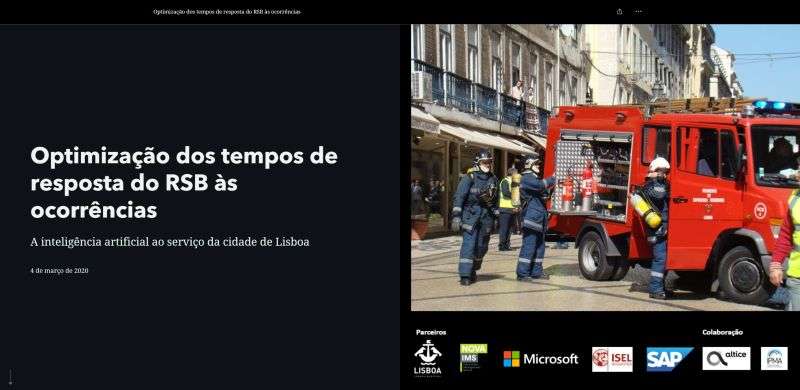
Anticipating the places with the highest risk of emergency occurrences is essential so that the emergency services can more efficiently allocate their resources in the city. It was with this objective to developed a predictive model that allows predicting the risk of emergency occurrences in the city of Lisbon.
This work was developed within the scope of the Lx Analytics Hub project for CML and the Firefighters Regiment, with the participation of ISEL, Microsoft and SAP.
Illegal Parking Score
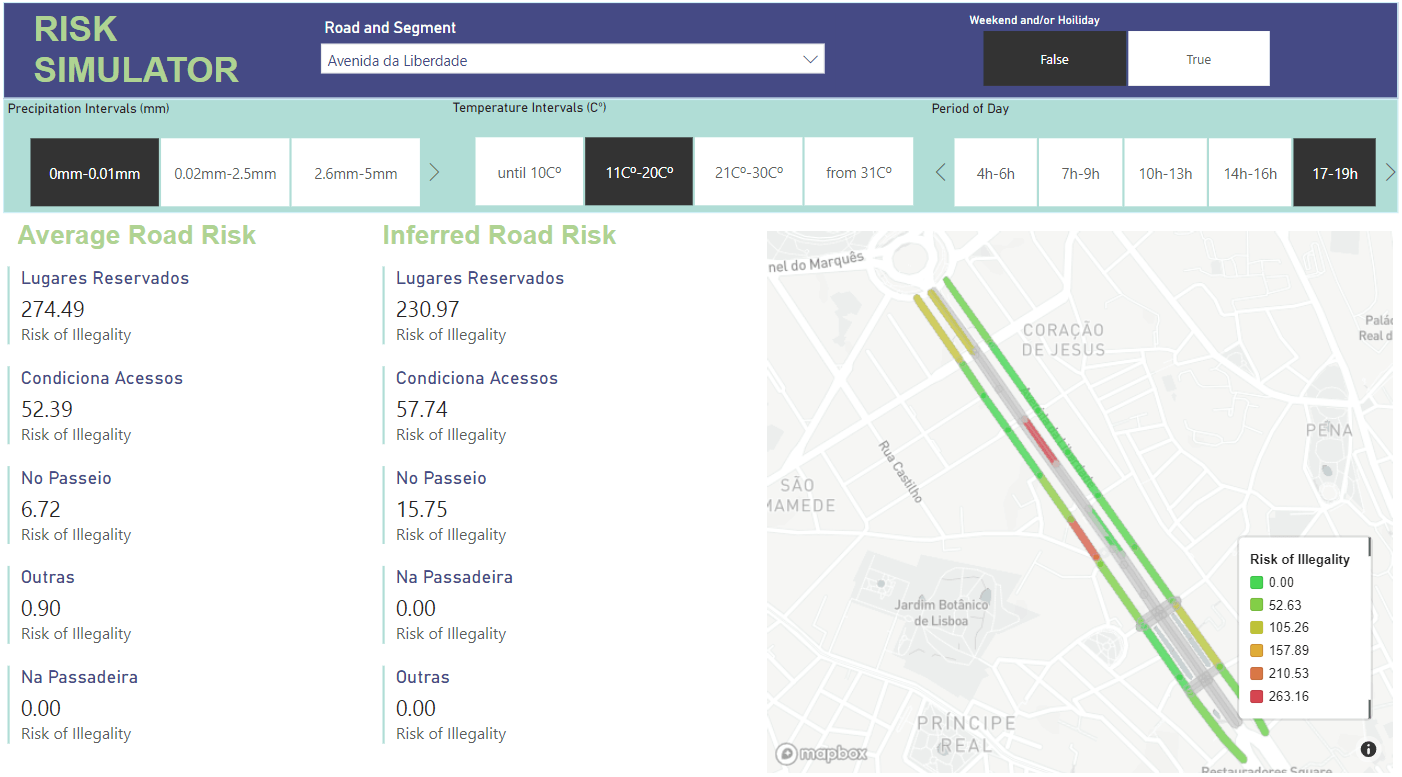
To enhance urban mobility in Lisbonwe have develop an innovative solution to tackle illegal parking in the city.
We introduce the Illegal Parking Score (IPS), an indicator that assesses the risk of illegal parking. The IPS is calculated based on the conditional probability of a parking infraction occurring given a set of conditions, including the road segment, period of the day, type of day, temperature, and precipitation.
To facilitate decision-making, we have developed a Dashboard for the IPS simulator, a tool that provides predictions on the risk of illegal parking based on user-defined spatiotemporal and weather conditions.
A detailed description of the applied methodology can be found at The illegal parking score – Understanding and predicting the risk of parking illegalities in Lisbon based on spatiotemporal features – ScienceDirect.
Join us in building smarter and more sustainable cities!
Protocol "Dados ao Serviço de Lisboa"
With access to data regarding the use of mobile devices and their location, it is possible to acquire a new perspective on problems of mobility and urban dynamics, both through descriptive models and predictive and/or prescriptive models. Additionally, the use of machine learning techniques and the development of analytical models allow the deepening of the study of issues related to the calculation of origin-destination trajectories.
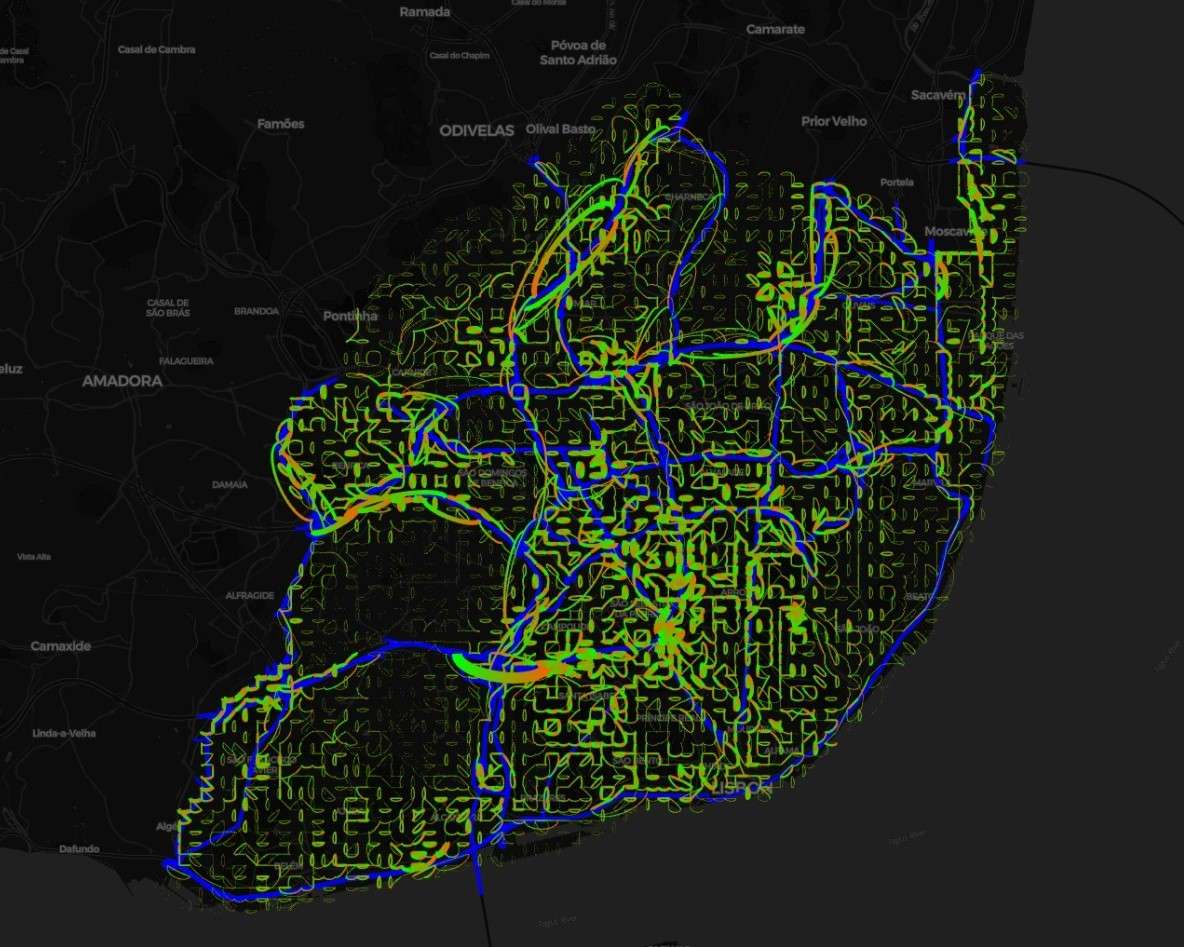
Under the protocol “Dados ao Serviço de Lisboa”, and in partnership with the Lisbon City Council (CML) and the Instituto Superior de Engenharia de Lisboa (ISEL), we are developing an in-depth analysis of the dynamics of commuting within the city of Lisbon through linear programming.
The image represents the flows in Lisbon between 08:00 and 08:05, considering the average of all working days and the travel time between cells. The origin of the movement is represented in red and the destination in green. The main roads of Lisbon are marked in blue.
Data source: Vodafone
IVDP Data + Project
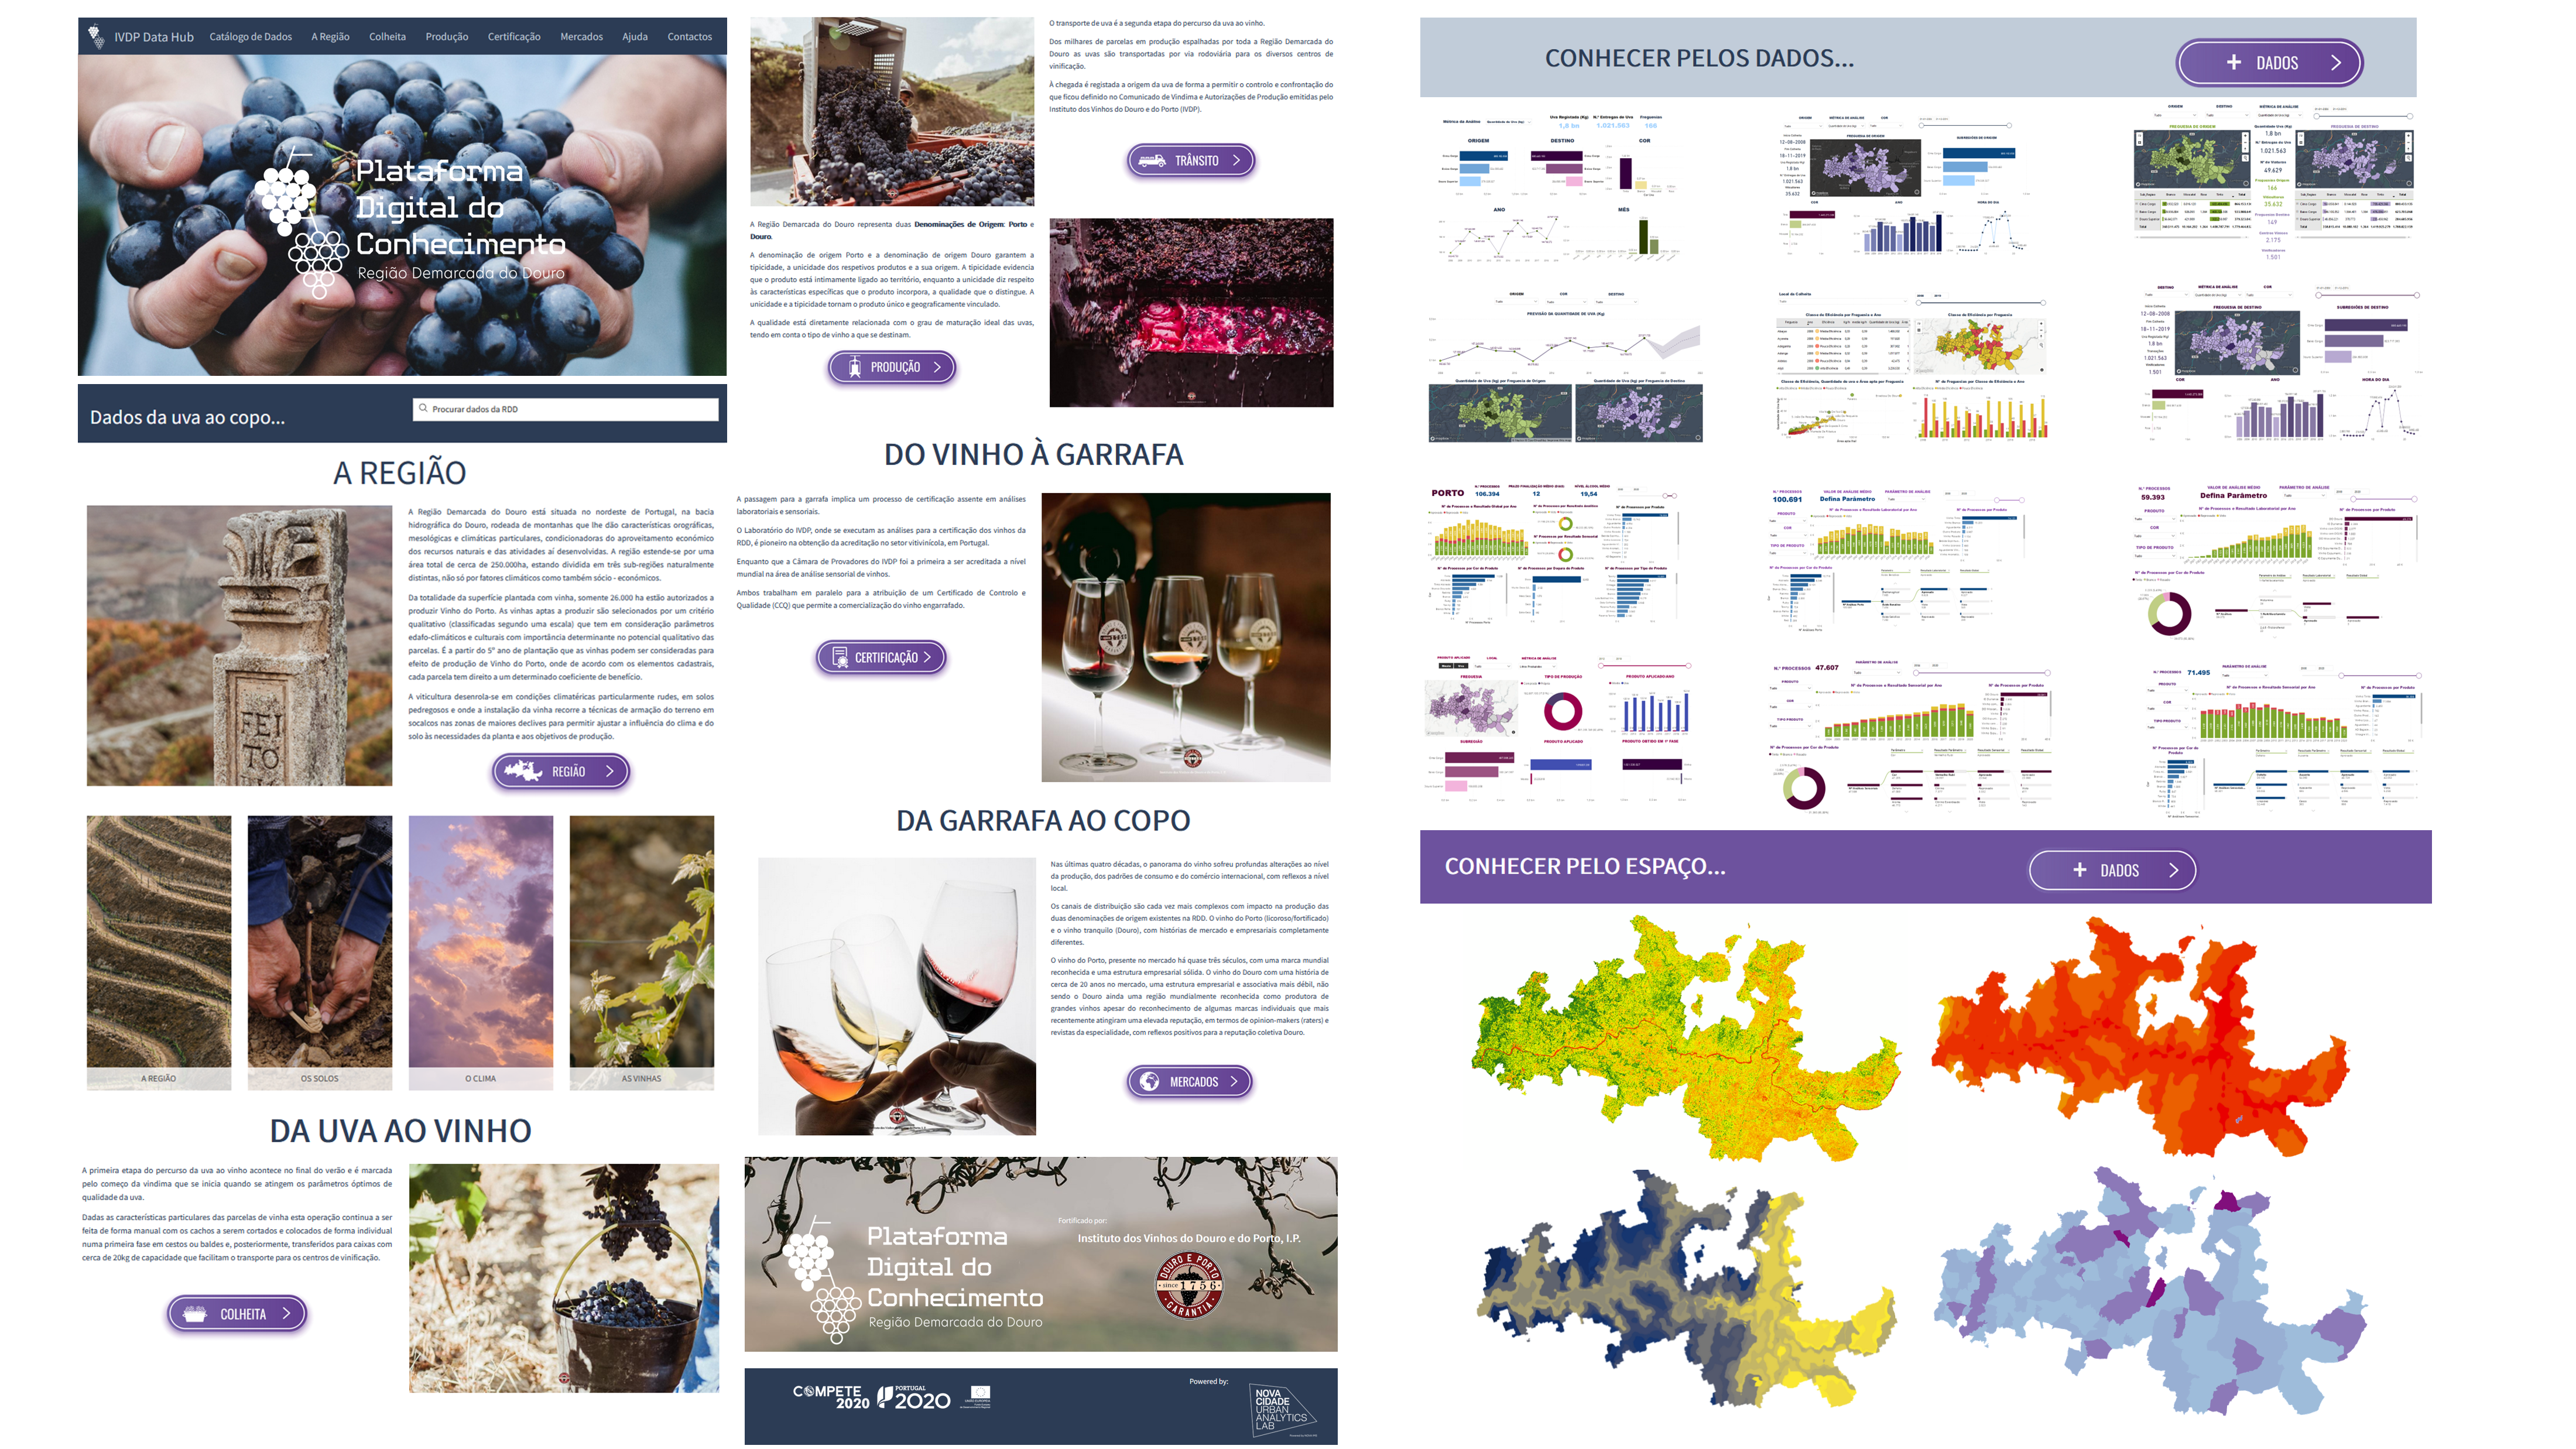
The Instituto dos Vinhos do Douro e do Porto launched the challenge of reinforcing knowledge of the Douro Demarcated Region in order to guarantee a significant evolution of the various contexts of wine production, taking advantage of the digital transformation and betting on sharing the best information available.
We have developed the Digital Knowledge Platform of the Douro Demarcated Region, combining skills in Geographic Information Systems, Data Analytics and Business Intelligence.
The platform covers the entire value chain from the grape to the glass and aims to provide easy, fast and transparent access to the most recent data and evolution trends, helping to understand the complexity of the challenges facing the wine sector, in a transversal way, to decision-makers, organizations and citizens. Allowing at the same time an approximation of all players in the value chain.
The knowledge goes through the data of the region, harvest, grape transit, production, certification and markets in the descriptive, predictive and prescriptive aspects, including a forecast model of the quantity of grapes at different scales based on historical production, satellite and climate data with a machine learning approach.
Data Sources: IVDP; IVV; IPMA; ESA
COVID-19 Insights
The COVID-19 Insights platform presents prospective indicators to support decision making by the business community, the academic community and the general public.
The project integrates multiple variables representing different economic, social and epidemiological aspects, which are analyzed using advanced analytical methods.
COVID-19 Insights provides information, updated daily – or weekly, for some indicators – on the international situation, the situation in Portugal, economic analysis (soon available), risk index, mobility and epidemiological models.
All indicators are available both in absolute and in relativized terms of the population of the several countries.
State of Urban Intelligence in Portugal
Analyze and publicize the state of investment in urban intelligence in Portuguese municipalities.
Designed with PowerBI technology and with the collaboration and important contributions of 49 members of the Section of Municipalities “Smart Cities”, located from north to south of the continental territory and in the Autonomous Regions.
LX Open Trees
Lisboa Aberta - EMEL
Urban Dynamic Indicator - Porto
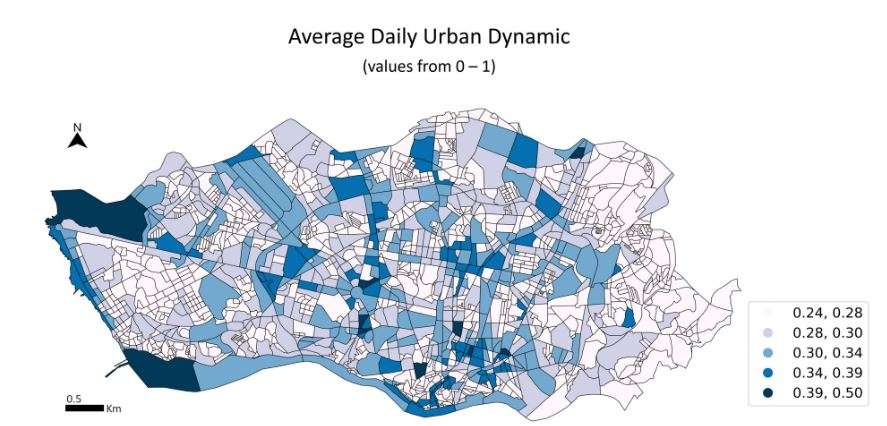
Cities committed to sustainability understand the importance of data-driven decision-making. Our research in partnership with Porto Digital, with the title “Urban dynamic in high spatiotemporal resolution: The case study of Porto” explores the power of data in evaluating urban environments by introducing the Urban Dynamic Indicator (UDI), a composite metric to measure urban dynamic in Câmara Municipal do Porto.
The UDI’s temporal trends shed light on urban life patterns, with weekdays and afternoons exhibiting peak dynamics.
This research isn’t just an academic endeavor; it’s a step towards smarter, more sustainable cities.
Solid waste production and collection
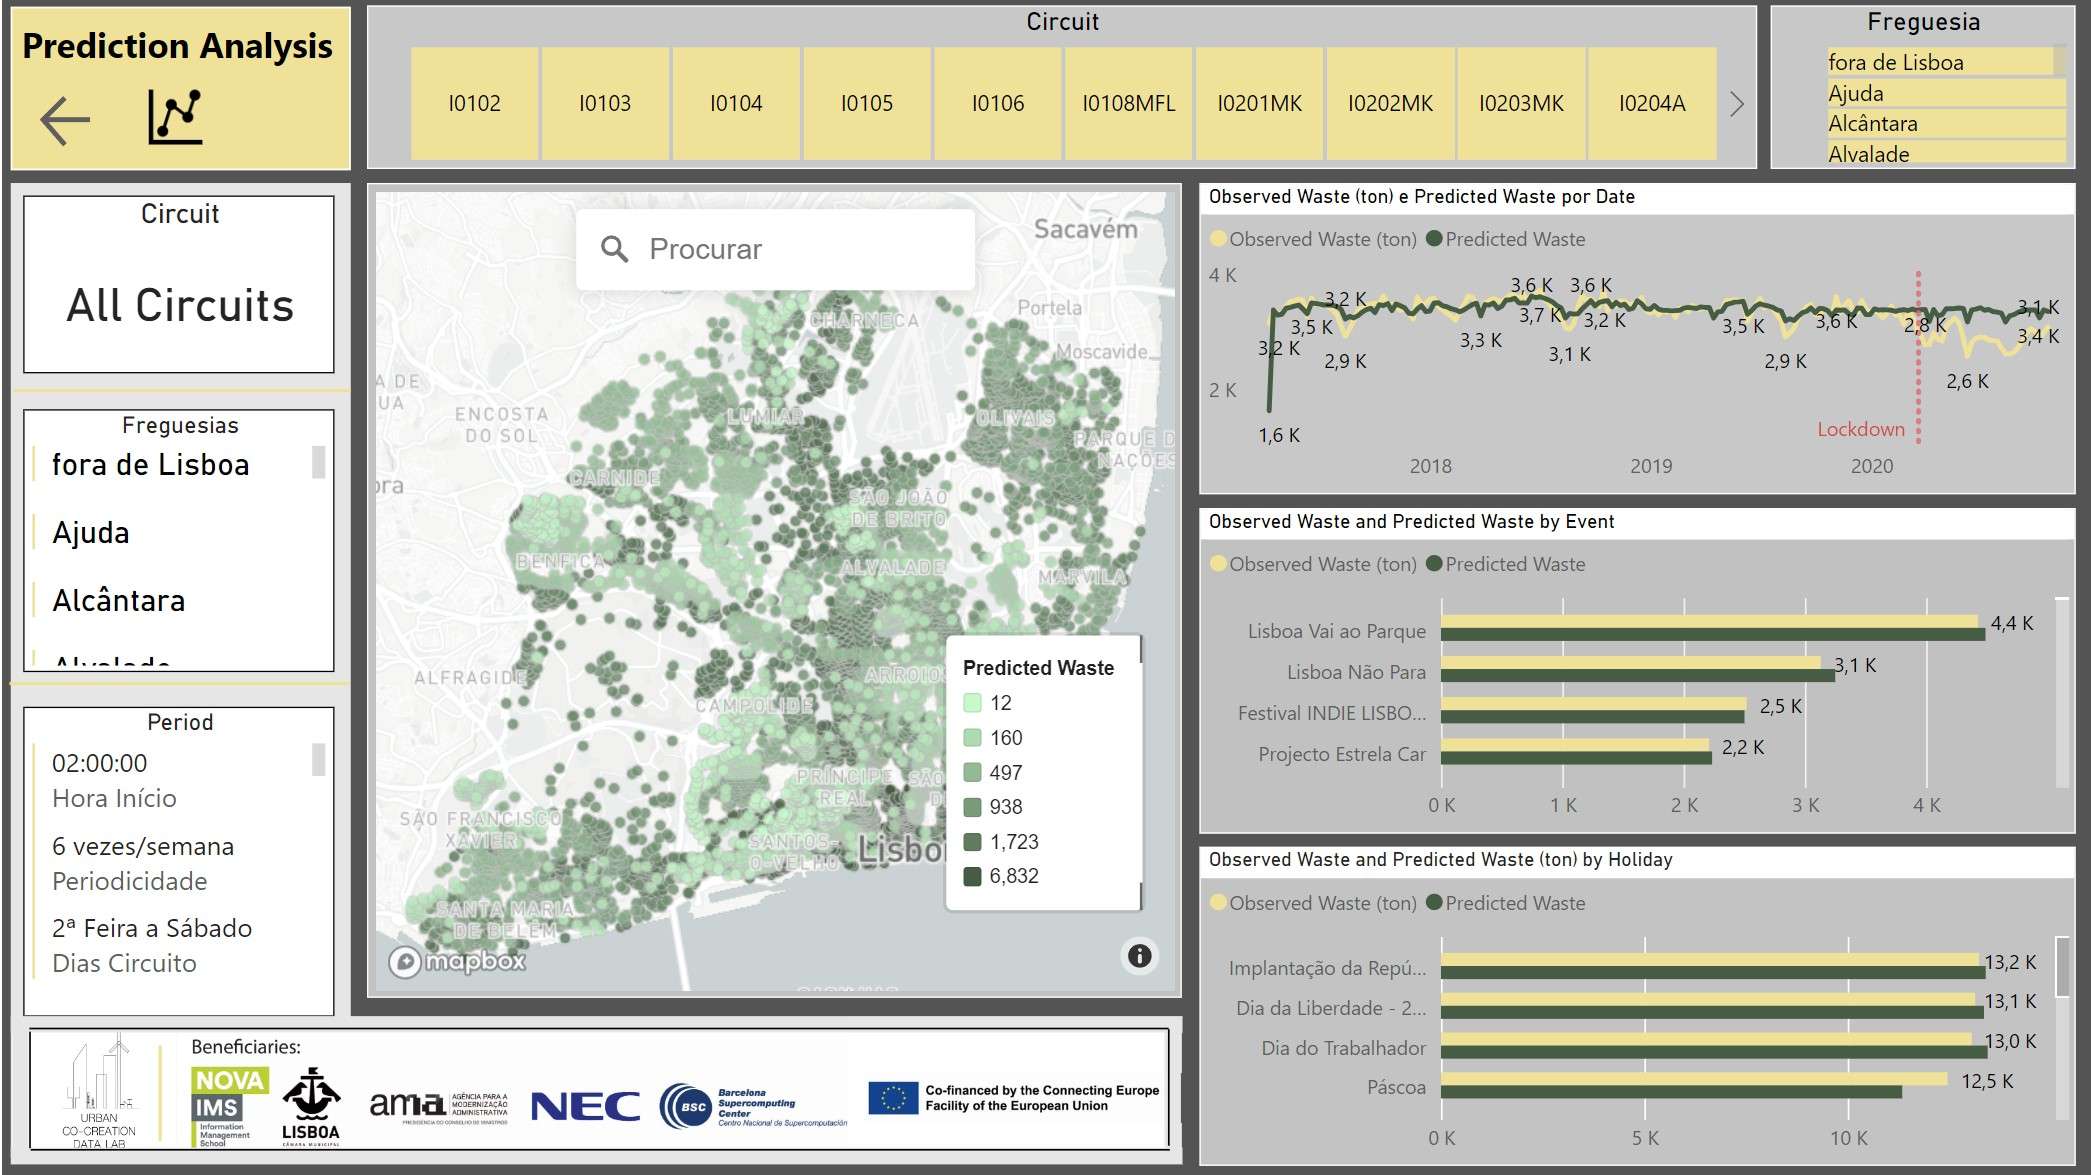
Solid waste production and collection have become a huge challenge for municipalities today. With waste collection costs accounting for 40 to 60% of waste management expenses, and the production of 4.2 to 12 kg of CO2 per tonne of collected waste, it’s clear that innovative solutions are needed.
Predictive model to forecast mixed waste production in Lisbon for each waste collection circuit throughout the month with precision.
This invaluable information allows to optimize the number of trucks required for waste collection in each circuit, resulting in significant cost savings and improved resource allocation.
Road safety
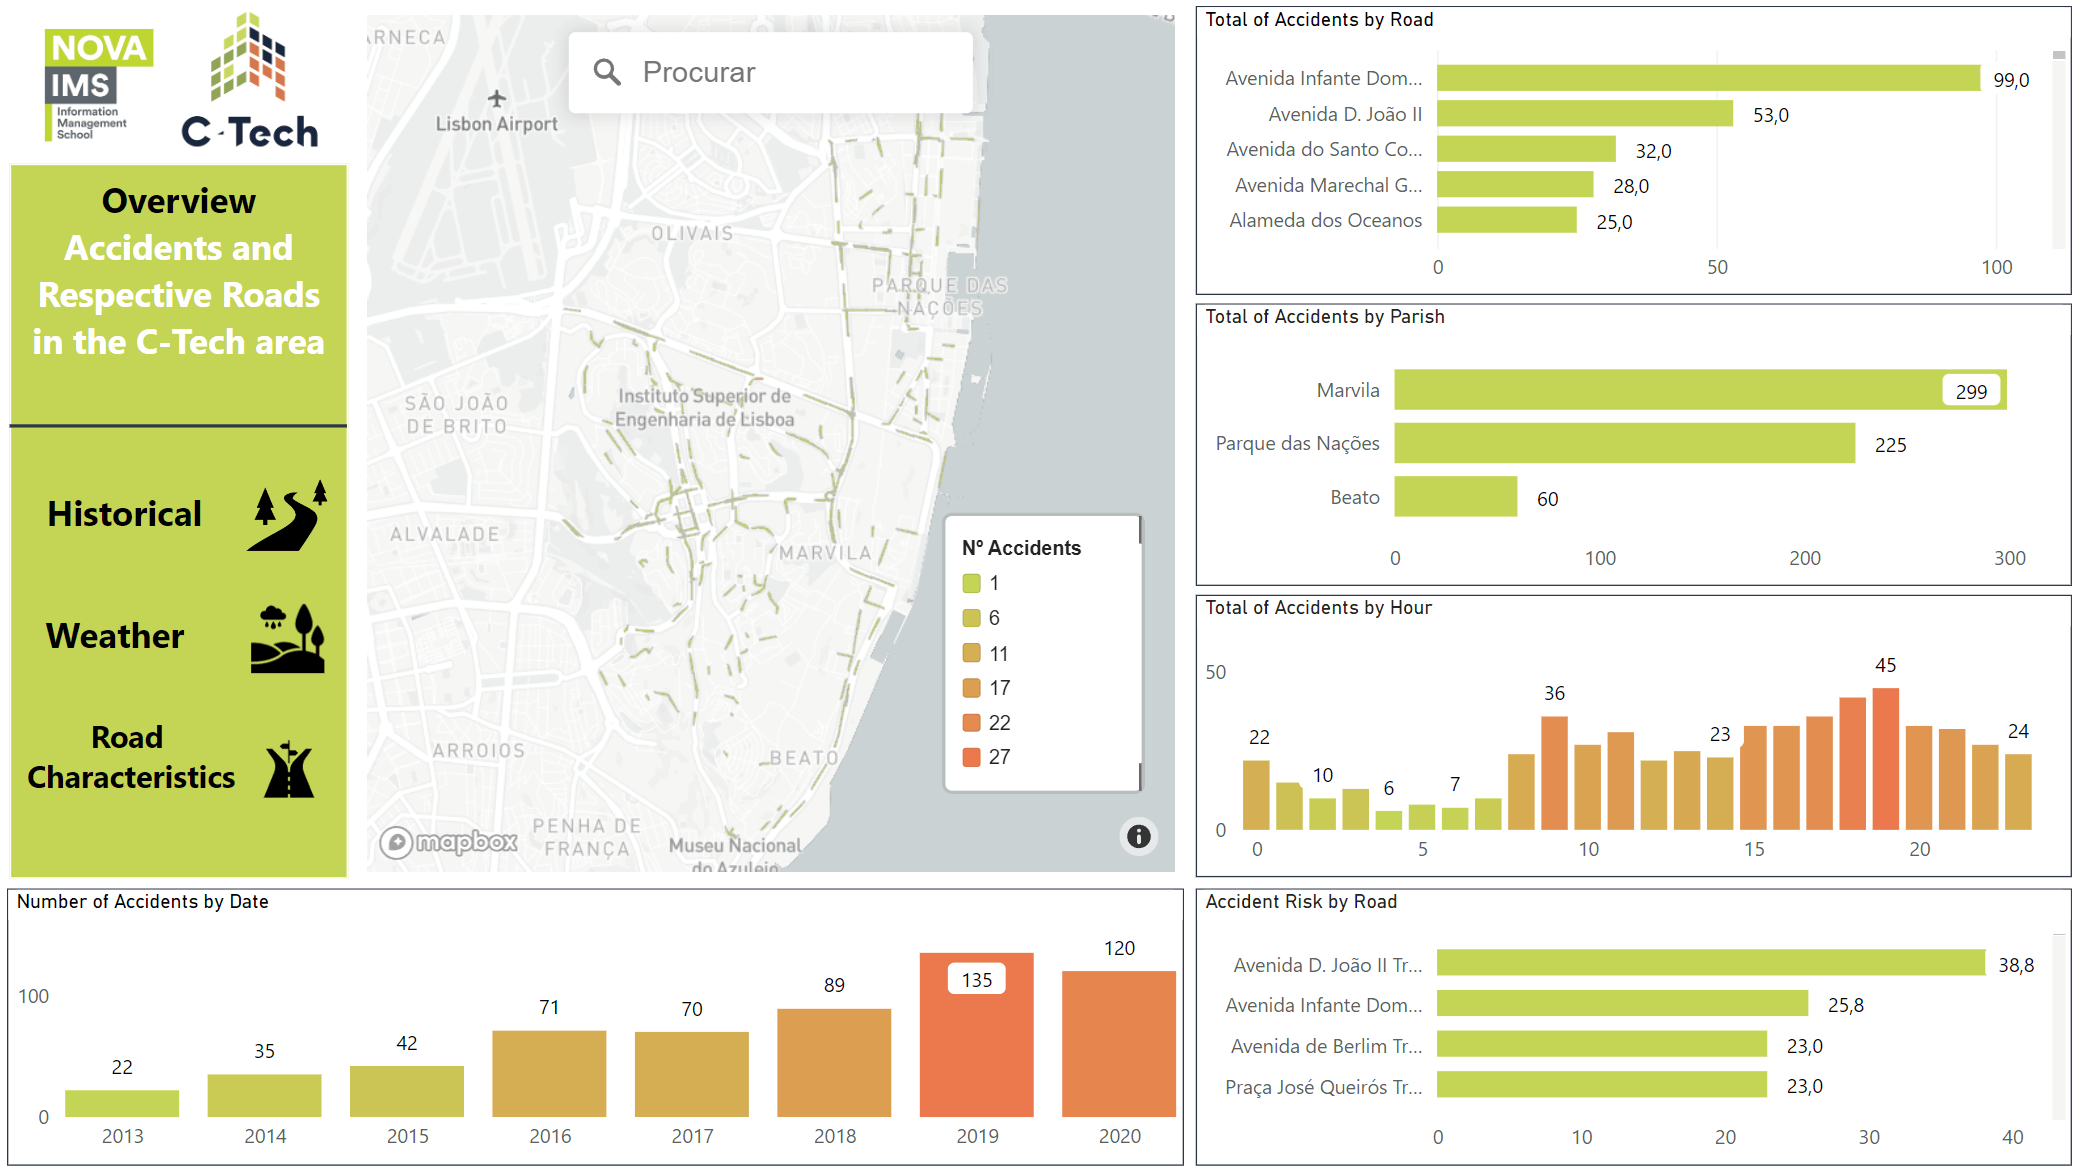
A dashboard that harnesses the potential of data analytics to enhance road safety and inform decision-making processes. With this dashboard, stakeholders can now gain valuable insights into car crash incidents within these specific areas.
Key features of the dashboard include:
- Advanced Data Visualization: Our intuitive visualizations allow users to explore and understand crash patterns, contributing factors, and severity levels with ease. Powerful charts, maps, and graphs provide a comprehensive overview of the incidents.
- Geographic Insights: Leveraging geo-spatial data, the dashboard provides a detailed view of accident hotspots, enabling authorities to pinpoint high-risk areas. This knowledge can guide the allocation of resources, such as traffic enforcement or infrastructure improvements, to maximize their effectiveness.
- Collaboration and Transparency: The dashboard promotes collaboration among stakeholders, fostering an environment of shared responsibility. By providing a centralized platform, it encourages data-driven discussions and facilitates informed decision-making processes. Transparency is enhanced as the insights are accessible to all authorized users.
The work was developed in the framework of the CTECH Project, that aims to leverage technology and data to create safer, more sustainable communities. This dashboard for car crash analysis aligns perfectly with this vision, empowering local authorities, traffic planners, and community members to actively contribute to road safety initiatives.
We are excited to embark on this journey of data-driven decision-making and collaborative efforts towards creating safer streets in Parque das Nações, Beato, and Marvila. Together, we can make a significant impact on road safety and transform our communities.
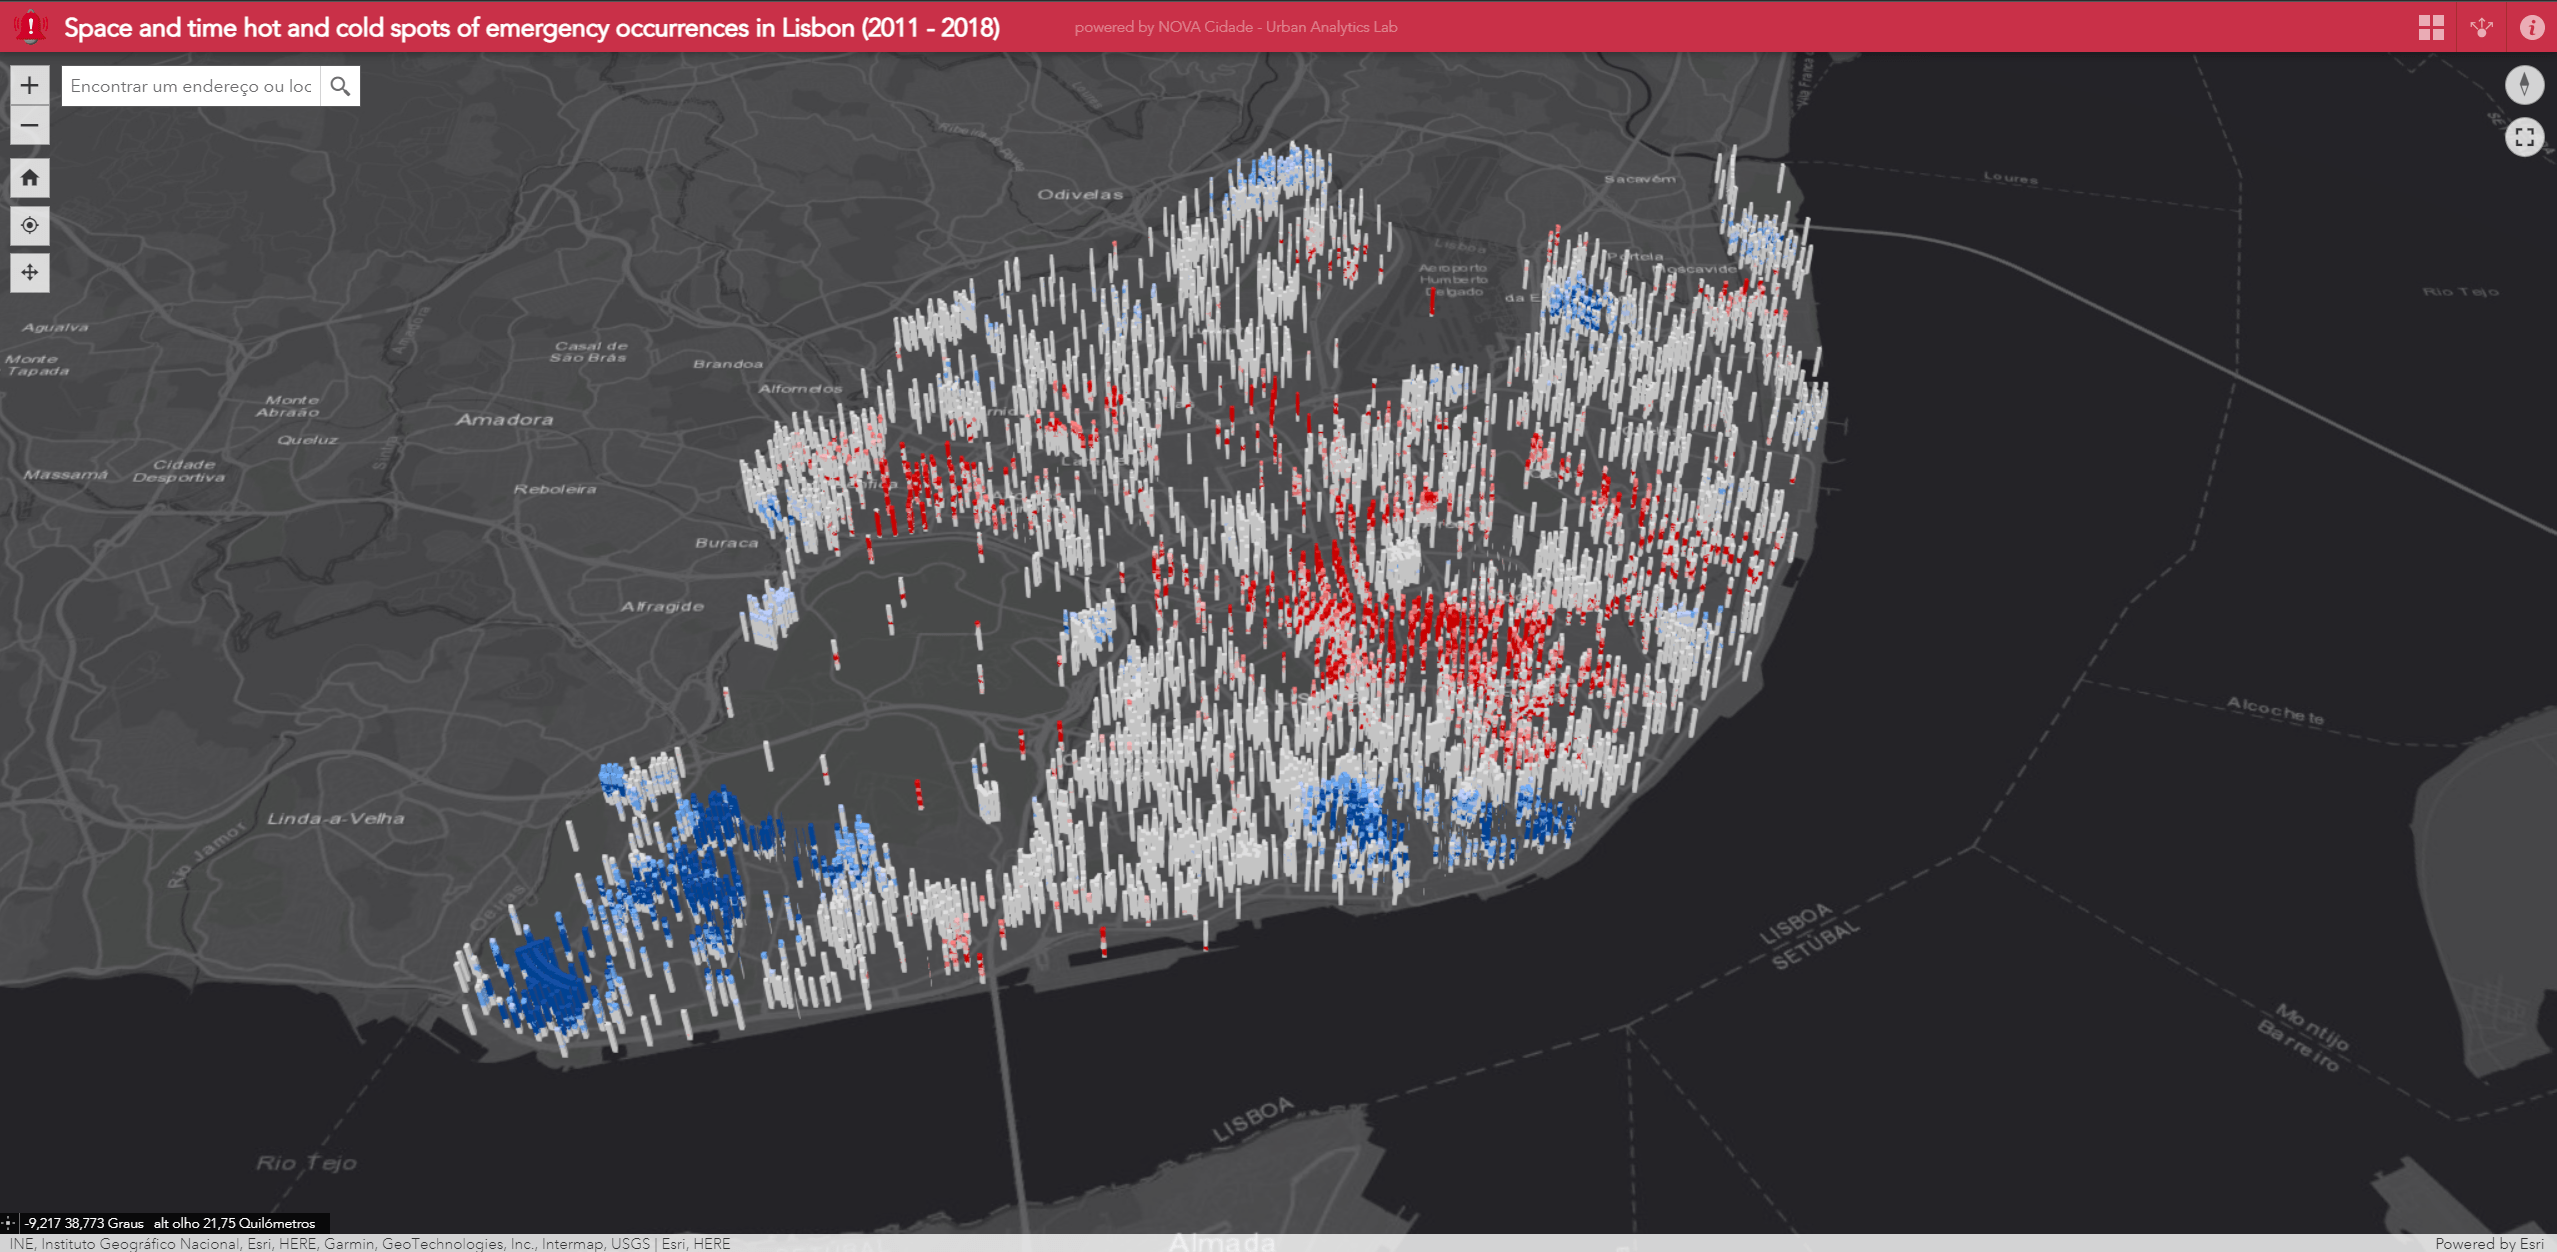
Patterns of Emergency Occurrences
Understanding spatially and temporally the patterns of emergency occurrences is essential for the prevention of deaths and injuries, reduction of damage to material goods and protection of the environment and community.
We developed an application with a space time cube with identification of hot spots and cold spots of emergencies where there was intervention of Lisbon professional firefighters (RSB) in the city of Lisbon between 2011 and 2018.
Each slice of the cube represents a period of 6 months and each location corresponds to the centroids of the Lisbon census tracts. Red and blue cubes correspond to locations and moments in time, of hot spots and cold spots respectively.
Data source: RSB/Lisbon Intelligent Management Platform (PGIL)
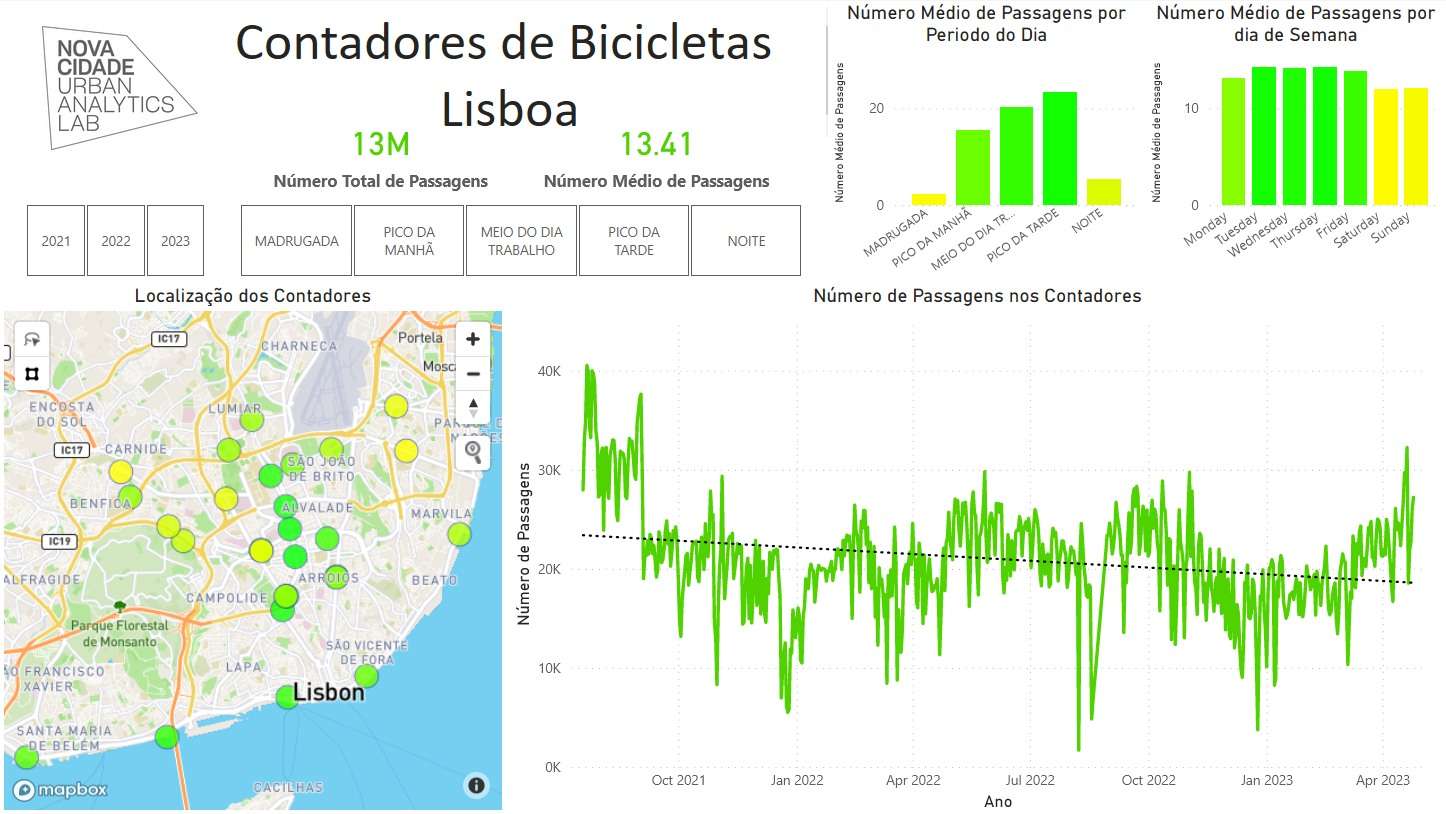
Bike Counter
The Bike Counter Dashboard is a comprehensive visualization tool that showcases the number of bike passages, from EMEL’s Open Data Portal, in several locations across Lisbon.
It provides valuable insights into the city’s cycling trends, encouraging sustainable transportation and promoting a healthier lifestyle.
The Bike Counter Dashboard aims to foster data-driven decision-making, supporting sustainable urban planning and transportation infrastructure development. By visualizing the number of bike passages, we can identify high-demand areas, plan for cycling infrastructure improvements, and ultimately contribute to a greener and healthier city.
E-Redes
Having access to accurate and transparent energy data is fundamental to drive positive changes in Portugal’s energy future. Leveraging the power of Power BI, we are pleased to present a dashboard that uses publicly available data about energy consumption from E-Redes open data portal.
This dashboard provides monthly consumption information across the country, with historical data available since November 2020, by municipality and voltage level.
We believe that this information can support data-driven decision-making by policymakers, researchers, businesses, and smart city initiatives looking to create a more sustainable future.
Data source: https://tinyurl.com/eredesconsumo
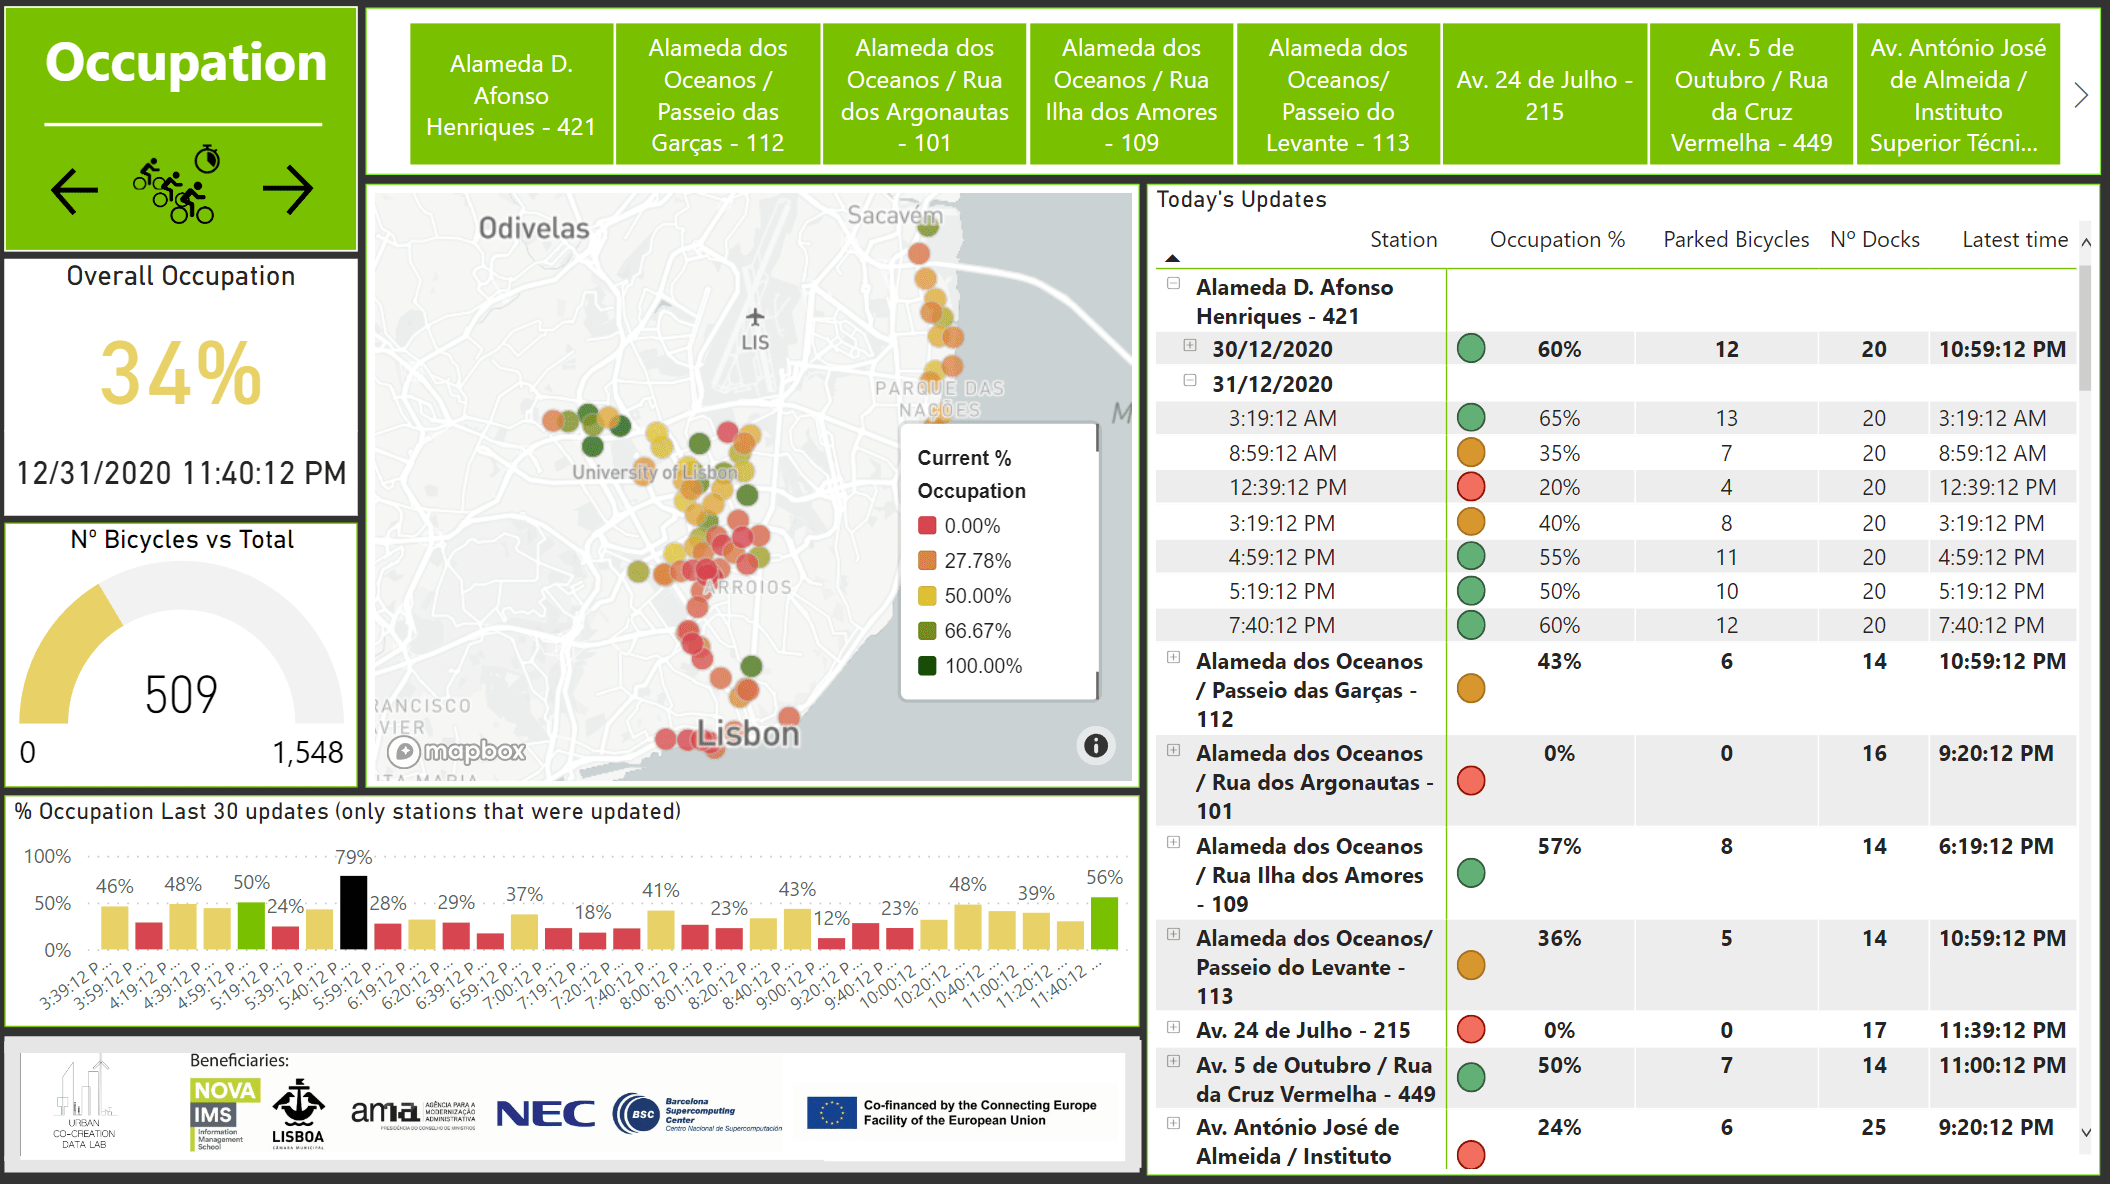
Urban Co-Creation Data Lab Project
The Lisbon City Council launched the challenge of the need to optimize the rebalancing of bicycles at the stations of the shared bicycle service in Lisbon – GIRA so that at each station there are always bicycles available to be used or empty docks for parking them.
We have developed a dashboard with information on the occupation of the docks with descriptive information on the use of the service, as well as a forecast model that makes it possible to anticipate the occupation of the docks in periods of three hours, with the aim of optimizing the rebalancing of the stations.
The input data used as well as the predictive model are available at Lisboa Aberta, Dados.gov and the European open data portal.
The work was developed within the framework of the Urban Co-Creation Data Lab project.
Data source: EMEL and IPMA
LX Analytics Hub Project
The LxAnalyticsHub innovation project arises from the need demonstrated by the Firefighters Department to have a solution that allows them to predict the best disposal of their resources in order to optimize the response time to occurrences.
To answer to this challenge, the Lisbon City Council promoted a partnership with SAP, Microsoft, NOVA IMS – Information Management School, ISEL – Instituto Superior de Engenharia de Lisboa and Altice, to which each entity contributed with the availability of some of its best human and technological resources.
With the collaboration of these entities, an analytical model was developed using predictive analysis algorithms, aiming to provide information that allows the positioning of the Firefighters Department operational means to be adjusted, in order to comply with a response time to events not exceeding 5 and 10 minutes.
The analytical model used the following data sources:
- historic of Firefighters Department occurrences;
- meteorological information from IPMA stations;
- traffic conditioning;
- traffic status;
- positioning of Altice’s mobile devices.
It was possible to test the predictive analytical model developed by NOVA IMS data scientists and supported on a datalake created and structured by ISEL, using Microsoft technology.
Given the great potential shown by the model, it is expected to be integrated into the Lisbon Intelligent Management Platform and made available to the Fire Departmnet for support in the daily operation of the teams.
Lisboa Inteligente / Smart Lisbon
In this project, the Lisbon City Council intends to publicize the work of the municipality in the development of initiatives that contribute to the transformation of the municipality into a smart city.
The project aims to contribute to the development of a management culture based on data, integrated, proactive, which promotes efficiency, transparency, innovation and the development of new services to the citizen.
The portal developed within the scope of this project, allows people to have knowledge about what the municipality is developing regarding smart cities.
This portal also contains all the municipal initiatives that the municipality will launch within the scope of smart cities.